
When Andrei Alexandrescu introduced ranges to the D programming language, the gap between built-in and user-defined types (UDTs) narrowed, enabling new abstractions and greater composability. Even today, though, UDTs are still second-class citizens in D. One example of this is support for head mutability–the ability to manipulate a reference without changing the referenced value(s). This document details a pattern that will further narrow the UDT gap by introducing functions for defining and working with head-mutable user-defined types.
Introduction
D is neither Kernel nor Scheme–it has first-class and second-class citizens. Among its first-class citizens are arrays and pointers. One of the benefits these types enjoy is implicit conversion to head-mutable. For instance, const(T[]) is implicitly convertible to const(T)[]. Partly to address this difference, D has many ways to define how one type may convert to or behave like another - alias this, constructors, opDispatch, opCast, and, of course, subclassing. The way pointers and dynamic arrays decay into their head-mutable variants is different from the semantics of any of these features, so we would need to define a new type of conversion if we were to mimic this behavior.
Changing the compiler and the language to permit yet another way of converting one type into another is not desirable: it makes the job harder for compiler writers, makes an already complex language even harder to learn, and any implicit conversion can make code harder to read and maintain. If we can define conversions to head-mutable data structures without introducing compiler or language changes, this will also make the feature available to users sooner, since such a mechanism would not necessarily require changes in the standard library, and users could gradually implement it in their own code and benefit from the code in the standard library catching up at a later point.
Unqual
The tool used today to get a head-mutable version of a type is std.traits.Unqual. In some cases, this is the right tool–it strips away one layer of const, immutable, inout, and shared. For some types though, it either does not give a head-mutable result, or it gives a head-mutable result with mutable indirections:
struct S(T) {
    T[] arr;
}
With Unqual, this code fails to compile:
void foo(T)(T a) {
    Unqual!T b = a; // cannot implicitly convert immutable(S!int) to S!int
}

unittest {
    immutable s = S!int([1,2,3]);
    foo(s);
}
A programmer who sees that message hopefully finds a different way to achieve the same goal. However, the error message says that the conversion failed, indicating that a conversion is possible, perhaps even without issue. An inexperienced programmer, or one who knows that doing so is safe right now, could use a cast to shut the compiler up:
void bar(T)(T a) {
    Unqual!T b = cast(Unqual!T)a;
    b.arr[0] = 4;
}

unittest {
    immutable s = S!int([1,2,3]);
    bar(s);
    assert(s.arr[0] == 1); // Fails, since bar() changed it.
}
If, instead of S!int, the programmer had used int[], the first example would have compiled, and the cast in the second example would have never seen the light of day. However, since S!int is a user-defined type, we are forced to write a templated function that either fails to compile for some types it really should support or gives undesirable behavior at run time.
headMutable()
Clearly, we should be able to do better than Unqual, and in fact we can. D has template this parameters which pick up on the dynamic type of the this reference, and with that, its const or immutable status:
struct S {
    void foo(this T)() {
        import std.stdio : writeln;
        writeln(T.stringof);
    }
}
unittest {
    S s1;
    const S s2;
    s1.foo(); // Prints "S".
    s2.foo(); // Prints "const(S)".
}
This way, the type has the necessary knowledge of which type qualifiers a head-mutable version needs. We can now define a method that uses this information to create the correct head-mutable type:
struct S(T) {
    T[] arr;
    auto headMutable(this This)() const {
        import std.traits : CopyTypeQualifiers;
        return S!(CopyTypeQualifiers!(This, T))(arr);
    }
}
unittest {
    const a = S!int([1,2,3]);
    auto b = a.headMutable();
    assert(is(typeof(b) == S!(const int))); // The correct part of the type is now const.
    assert(a.arr is b.arr); // It's the same array, no copying has taken place.
    b.arr[0] = 3; // Correctly fails to compile: cannot modify const expression.
}
Thanks to the magic of Uniform Function Call Syntax, we can also define headMutable() for built-in types:
auto headMutable(T)(T value) {
    import std.traits;
    import std.typecons : rebindable;
    static if (isPointer!T) {
        // T is a pointer and decays naturally.
        return value;
    } else static if (isDynamicArray!T) {
        // T is a dynamic array and decays naturally.
        return value;
    } else static if (!hasAliasing!(Unqual!T)) {
        // T is a POD datatype - either a built-in type, or a struct with only POD members.
        return cast(Unqual!T)value;
    } else static if (is(T == class)) {
        // Classes are reference types, so only the reference may be made head-mutable.
        return rebindable(value);
    } else static if (isAssociativeArray!T) {
        // AAs are reference types, so only the reference may be made head-mutable.
        return rebindable(value);
    } else {
        static assert(false, "Type "~T.stringof~" cannot be made head-mutable.");
    }
}
unittest {
    const(int*[3]) a = [null, null, null];
    auto b = a.headMutable();
    assert(is(typeof(b) == const(int)*[3]));
}
Now, whenever we need a head-mutable variable to point to tail-const data, we can simply call headMutable() on the value we need to store. Unlike the ham-fisted approach of casting to Unqual!T, which may throw away important type information and also silences any error messages that may inform you of the foolishness of your actions, attempting to call headMutable() on a type that doesn’t support it will give an error message explaining what you tried to do and why it didn’t work (“Type T cannot be made head-mutable.”). The only thing missing now is a way to get the head-mutable type. Since headMutable() returns a value of that type, and is defined for all types we can convert to head-mutable, that’s a template one-liner:
import std.traits : ReturnType;
alias HeadMutable(T) = ReturnType!((T t) => t.headMutable());
Where Unqual returns a type with potentially the wrong semantics and only gives an error once you try assigning to it, HeadMutable disallows creating the type in the first place. The programmer will have to deal with that before casting or otherwise coercing a value into the variable. Since HeadMutable uses headMutable() to figure out the type, it also gives the same informative error message when it fails.
Lastly, since one common use case requires us to preserve the tail-const or tail-immutable properties of a type, it is beneficial to define a template that converts to head-mutable while propagating const or immutable using std.traits.CopyTypeQualifiers:
import std.traits : CopyTypeQualifiers;
alias HeadMutable(T, ConstSource) = HeadMutable!(CopyTypeQualifiers!(ConstSource, T));
This way, immutable(MyStruct!int) can become MyStruct!(immutable int), while the const version would propagate constness instead of immutability.
Example Code
Since the pattern for range functions in Phobos is to have a constructor function (e.g. map) that forwards its arguments to a range type (e.g. MapResult), the code changes required to use headMutable() are rather limited. Likewise, user code should generally not need to change at all in order to use headMutable(). To give an impression of the code changes needed, I have implemented map and equal:
import std.range;

// Note that we check not if R is a range, but if HeadMutable!R is
auto map(alias Fn, R)(R range) if (isInputRange!(HeadMutable!R)) {
    // Using HeadMutable!R and range.headMutable() here.
    // This is basically the extent to which code that uses head-mutable data types will need to change.
    return MapResult!(Fn, HeadMutable!R)(range.headMutable());
}

struct MapResult(alias Fn, R) {
    R range;

    this(R _range) {
        range = _range;
    }

    void popFront() {
        range.popFront();
    }

    @property
    auto ref front() {
        return Fn(range.front);
    }

    @property
    bool empty() {
        return range.empty;
    }

    static if (isBidirectionalRange!R) {
        @property
        auto ref back() {
            return Fn(range.back);
        }

        void popBack() {
            range.popBack();
        }
    }

    static if (hasLength!R) {
        @property
        auto length() {
            return range.length;
        }
        alias opDollar = length;
    }

    static if (isRandomAccessRange!R) {
        auto ref opIndex(size_t idx) {
            return Fn(range[idx]);
        }
    }

    static if (isForwardRange!R) {
        @property
        auto save() {
            return MapResult(range.save);
        }
    }

    static if (hasSlicing!R) {
        auto opSlice(size_t from, size_t to) {
            return MapResult(range[from..to]);
        }
    }

    // All the above is as you would normally write it.
    // We also need to implement headMutable().
    // Generally, headMutable() will look very much like this - instantiate the same
    // type template that defines typeof(this), use HeadMutable!(T, ConstSource) to make
    // the right parts const or immutable, and call headMutable() on fields as we pass
    // them to the head-mutable type.
    auto headMutable(this This)() const {
        alias HeadMutableMapResult = MapResult!(Fn, HeadMutable!(R, This));
        return HeadMutableMapResult(range.headMutable());
    }
}

auto equal(R1, R2)(R1 r1, R2 r2) if (isInputRange!(HeadMutable!R1) && isInputRange!(HeadMutable!R2)) {
    // Need to get head-mutable version of the parameters to iterate over them.
    auto _r1 = r1.headMutable();
    auto _r2 = r2.headMutable();
    while (!_r1.empty && !_r2.empty) {
        if (_r1.front != _r2.front) return false;
        _r1.popFront();
        _r2.popFront();
    }
    return _r1.empty && _r2.empty;
}

unittest {
    // User code does not use headMutable at all:
    const arr = [1,2,3];
    const squares = arr.map!(a => a*a);
    const squaresPlusTwo = squares.map!(a => a+2);
    assert(equal(squaresPlusTwo, [3, 6, 11]));
}
(Note that these implementations are simplified slightly from Phobos code to better showcase the use of headMutable)
The unittest block shows a use case where the current Phobos map would fail–it is perfectly possible to create a const MapResult, but there is no way of iterating over it. Note that only two functions are impacted by the addition of headMutable(): map tests if HeadMutable!R is an input range and converts its arguments to head-mutable when passing them to MapResult, and MapResult needs to implement headMutable(). The rest of the code is exactly as you would otherwise write it.
The implementation of equal() shows a situation where implicit conversions would be beneficial. For const(int[]) the call to headMutable() is superfluous–it is implicitly converted to const(int)[] when passed to the function. For user-defined types however, this is not the case, so the call is necessary in the general case.
While I have chosen to implement a range here, ranges are merely the most common example of a place where headmutable would be useful; the idea has merits beyond ranges. Another type in the standard library that would benefit from headmutable is RefCounted!T: const(RefCounted!(T)) should convert to RefCounted!(const(T)).
Why not Tail-Const?
In previous discussions of this problem, the solution has been described as tail-const, and a function tailConst() has been proposed. While this idea might at first seem the most intuitive solution, it has some problems, which together make headMutable() far superior.
The main problem with tailConst() is that it does not play well with D’s existing const system. It needs to be called on a mutable value, and there is no way to convert a const(Foo!T) to Foo!(const(T)). It thus requires that the programmer explicitly call tailConst() on any value that is to be passed to a function expecting a non-mutable value and, abstain from using const or immutable to convey the same information. This creates a separate world of tail-constness and plays havoc with generic code, which consequently has no way to guarantee that it won’t mutate its arguments.
Secondly, the onus is placed on library users to call tailConst() whenever they pass an argument anywhere, causing an inversion of responsibility: the user has to tell the library that it is not allowed to edit the data instead of the other way around. In the best case, this merely causes unnecessary verbiage. In other cases, the omission of const will lead to mutation of data expected to be immutable.
A minor quibble in comparison is that the tail-const solution also requires the existence of tailImmutable to cover the cases where the values are immutable.
Issues
The ideas outlined in this document concern only conversion to head-mutable. A related issue is conversion to tail const, e.g. from RefCounted!T or RefCounted!(immutable T) to RefCounted!(const T), a conversion that, again, is implicit for arrays and pointers in D today.
One issue that may be serious is the fact that headMutable often cannot be @safe and may, in fact, need to rely on undefined behavior in some places. For instance, RefCounted!T contains a pointer to the actual ref count. For immutable(RefCounted!T), headMutable() would need to cast away immutable, which is undefined behavior per the spec.
The Compiler Solution
It is logical to think that, as with built-in types, headMutable() could be elided in its entirety, and the compiler could handle the conversions for us. In many cases, this would be possible, and in fact the compiler already does so for POD types like struct S { int n; }–a const or immutable S may be assigned to a mutable variable of type S. This breaks down, however, when the type includes some level of mutable indirection. For templated types it would be possible to wiggle the template parameters to see if the resulting type compiles and has fields with the same offsets and similar types, but even such an intelligent solution breaks down in the presence of D’s Turing-complete template system, and some cases will always need to be handled by the implementer of a type.
It is also a virtue that the logic behind such an implementation be understandable to the average D programmer. The best case result of that not being true is that the forums would be inundated with a flood of posts about why types don’t convert the way users expect them to.
For these reasons, headMutable() will be necessary even with compiler support. But what would that support look like? Implicit casting to head-mutable happens in the language today in two situations:
-
Assignment to head-mutable variables:
const(int)[] a = create!(const(int[]))();(all POD types, pointers and arrays) -
Function calls:
fun(create!(const(int[]))();(only pointers and arrays)
The first is covered by existing language features (alias headMutable this; fits the bill perfectly). The second is not but is equivalent to calling .headMutable whenever a const or immutable value is passed to a function that does not explicitly expect a const or immutable argument. This would change the behavior of existing code, in that templated functions would prefer a.headMutable over a, but would greatly improve the experience of working with const types that do define headMutable(). If headMutable is correctly implemented, the different choice of template instantiations should not cause any actual breakage.
Future Work
While this document proposes to implement the described feature without any changes to the compiler or language, it would be possible for the compiler in the future to recognize headMutable() and call it whenever a type that defines that method is passed to a function that doesn’t explicitly take exactly that type, or upon assignment to a variable that matches headMutable()’s return value. This behavior would mirror the current behavior of pointers and arrays.
Conclusion
It is possible to create a framework for defining head-mutable types in D today without compiler or language changes. It requires a little more code in the methods that use head-mutable types but offers a solution to a problem that has bothered the D community for a long time.
While this document deals mostly with ranges, other types will also benefit from this pattern: smart pointers and mutable graphs with immutable nodes are but two possible examples.
Definitions
Head-mutable
A type is head-mutable if some or all of its members without indirections are mutable. Note that a head-mutable datatype may also have const or immutable members without indirections; the requirement is merely that some subset of its members may be mutated. A head-mutable datatype may be tail-const, tail-immutable or tail-mutable–head-mutable only refers to its non-indirected members. Examples of head-mutable types include const(int)[], int*, string, and Rebindable!MyClass. Types without indirections (like int, float and struct S { int n; }) are trivially head-mutable.
Tail-const
A type is tail-const if some of its members with indirections have the const type qualifier. A tail-const type may be head-mutable or head-const. Examples of tail-const types are const(int)*, const(int[]), const(immutable(int)[])* and string.
Source
The source code for HeadMutable and headMutable is available here.
 Thanks to everyone who has shopped in

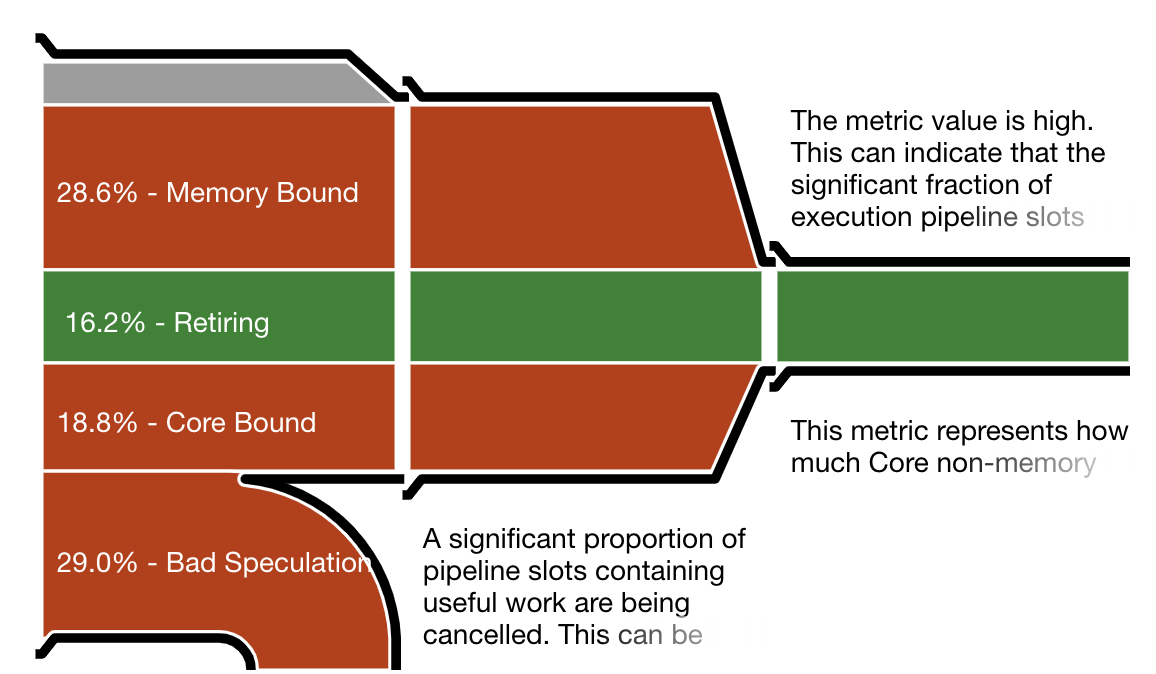 Intel VTune pipe efficiency diagram for the Hoare partition. A large percentage of work is wasted on failed speculation.
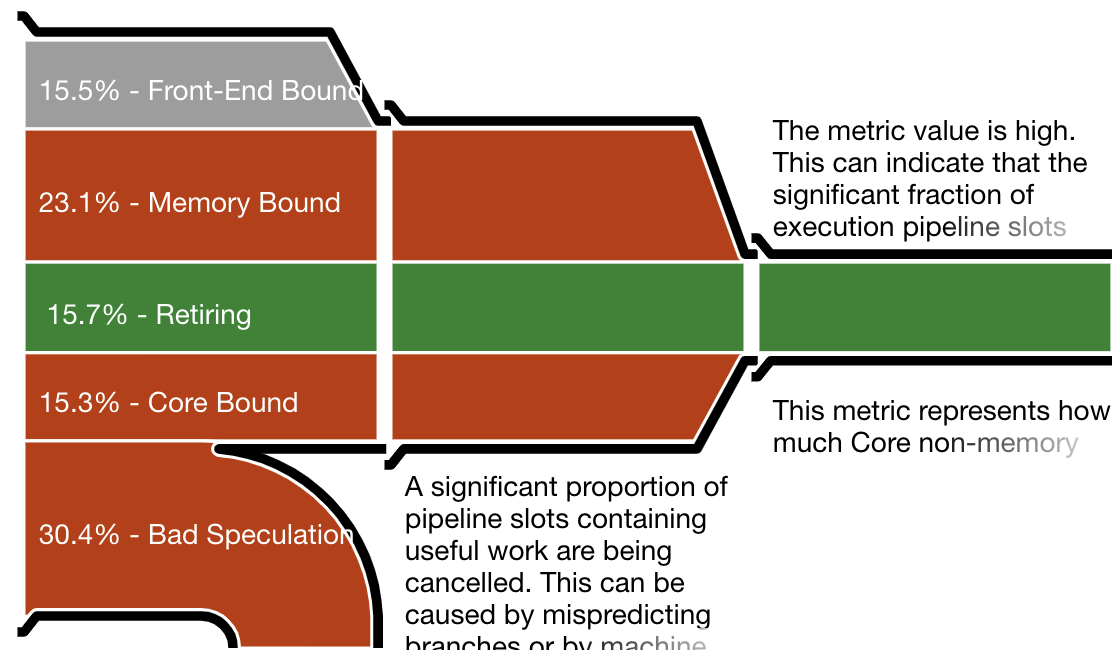 Intel VTune pipe efficiency diagram for the traditional “branchy” Lomuto partition, featuring about as much failed speculation as the Hoare partition.
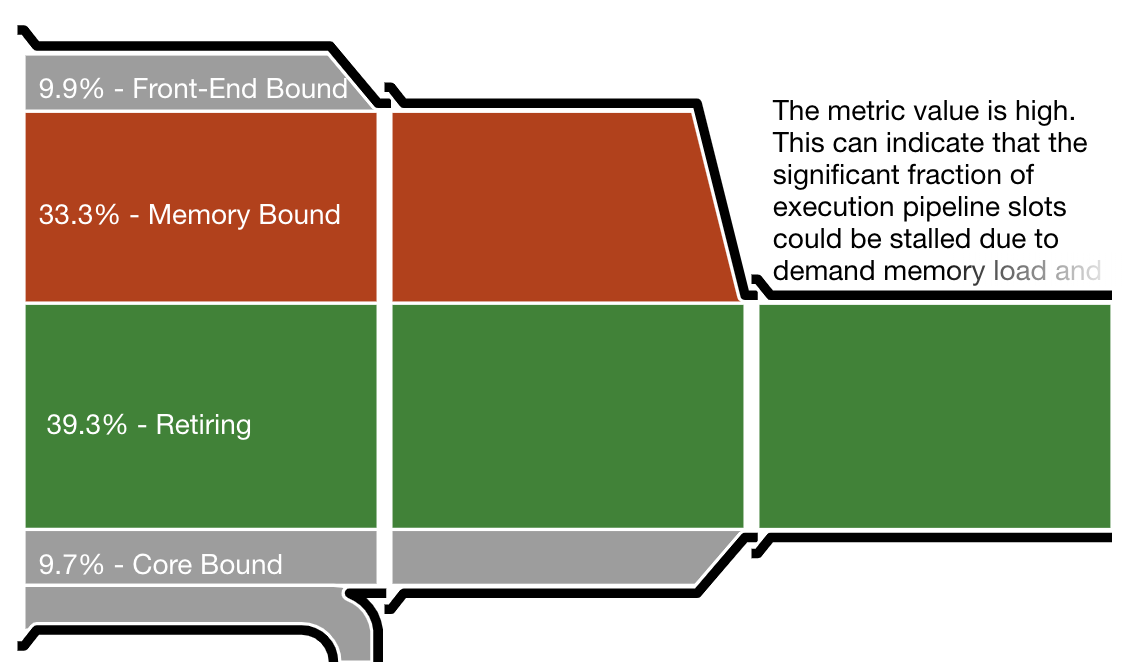 Intel VTune pipe efficiency diagram for the Lomuto branch-free partition. Virtually no work is wasted on failed speculation, leading to a much better efficiency.
 At one time or another during application development you need to make a decision: does your application work like it should and, if not, what is wrong with it? There are different techniques to help you decide, some of which are logging, tracing, and profiling. How are they different? One way to look at it is like this: